DISCIPLINARY

SET
___________________________________
Welcome back! For this blog post I have collected the following text-set of 7 different texts related to my inquiry topic of volume and surface area. I have included a range of different texts such as print texts, media texts, and culturally relevant texts. For each category (in GREEN), two/three texts are listed. One of these texts will include a annotated description, while the others are given for you to further investigate the topic. All texts are to be used for students to build content knowledge and background knowledge about surface area and volume. I evaluated the text complexity of the texts I gathered in three different dimensions: quantitative, qualitative and context. For the quantitative element, I used StoryTools which evaluates the text with a variety of different aspects including: reading levels, sentence information, word usage and sentence beginnings. For the screencast I used the quantitative char called Finding Common Core Grade Levels for Texts: Quick Reference Chart. I evaluated the qualitative aspect of my texts by referring to the Achieve The Core rubric. In addition to the text complexity analysis, each annotated text will be paired with a brief description of a task. In doing so, I consider the complexity of the task, and text, so that it is balanced and suitable for students.
 In relation to the CCSSM, these texts can range from 6-12th grade depending upon the corresponding text and task complexity. Students are first introduced to area in 6th grade and build upon this concept throughout their educational careers. For example, in 8th grade they use concepts of area to find surface area formulas, which later allows them to derive formulas of volume for regular and irregular figures. Although they spread across a wide range of grade levels I believe a couple texts can be paired together and used consecutively. Some of these readings are ideal for introducing the topic to learners with little to no background knowledge, while others require flexibility, abstract thinking, and prior experience to comprehend. This being said, some of these texts may be useful overtime as students gain comfort and deepen their understanding of area, surface area, and volume. Let's take a look!
Multimedia Texts:
Bibliographic Information:
"Volume." (screencast). Screencast-O-Matic. 8 Apr. 2016. 27 July 2017. <https://screencast-o-matic.com/watch/cDfjbh1adG>.

Summary:
This organized and easy to follow screencast focuses on how to use the volume formula of different shapes, and expects that students know the basics about volume prior to watching (def.,units, etc.). So, viewers should already understand and be able to draw different 3D figures like cubes, prism, triangular prism, cylinder, cone, sphere. The volume of these shapes are demonstrated once (after a brief review). As the examples are calculated, the calculator being used is shown on the screen which I think is beneficial to students and is something I haven't thought about before. I say this because she models how she multiplies [(4/3)𝝅r³] in her head and just writes [(4𝜋r³)/3]. What makes this video unique from the two below is the relationship discussed about the term "congruent" and "same". The dimensional analysis that this video mentions allows students to focus on the characteristics of each shape, specifically the qualities a figure has when observing each side and base (top/bottom/side) shapes. One thing that is pointed out that I believe is very beneficial for students to understand is the concept that a rectangular prism sliced in half diagonally produces two triangular prisms. This is crucial for students to pick up on as they will be required to take the volume of irregular shapes as the unit progresses. Being able to break up irregular shapes into shapes that you can easily work with will be a task that students will do in future lessons. Text Complexity:
Listening to the screencast and evaluating the text involved, I place the quantitative text complexity of this to be slightly complex. This is supported by the CCSSM for geometry in the 8th grade range where students would consider this to be a review of material. According to the Qualitative Measures Rubric this is a slightly complex due to its simple text structure. The organization is clear and in stages. The review then examples makes it straightforward and obvious to what comes next. There were only a few words that students were not expected to know off hand, while most of them were expected to be understood and used flexibly causing the language features to be moderately complex. For meaning I am split between moderately complex and slightly complex. It only focused on volume, yet it included several different types of figures. Based off of the knowledge demands, I would rate this moderately complex because it relied mostly on the viewers to already have a general understanding of volume, surface area, and different 3 dimensional shapes. Overall i would rate this moderately complex.
Task Complexity:
To balance out the slightly complex text i would pair this with a very complex or exceedingly complex task. The purpose of this is for students to determine the volume of a cone, sphere by using a formula, which is in the CCSSM under 8th grade geometry. So, an activity that would pair well with this would be a version of the Say/Mean/Matter chart (but completely different). In one column students would draw and label EACH type of figure. In the next, they define using their own reasoning and formula, and then in the last column create a problem in which they choose the measurements and then solve for volume. Additional Text:
“Learn to find the Volume & Surface Area of a Cylinder | Common Core Geometry.” YouTube. MashUp Math, 14 Sep. 2015. Web. 27 July 2017. <https://www.youtube.com/watch?v=Bb_XJ7UPDlM>

Abstract: This 7 -minute video explores the properties of cylinders and explains how students can apply the formula's when finding Surface Area and volume of different sized cylinders. During the video, two problems are solved using a problem-solving approach, but before viewers are walked through the basic concepts of surface area and volume. It starts off very basic introducing the figure of a cylinder and examples of it in the real world. It focuses on how a cylinder is created which allows students to see where cylinders come from and how they are created. One thing i particularly liked about the video is that the narrator uses student language. An example of this is how he doesn't start with explaining volume as length times width time height (the formula), rather he explains it as how much space an object can hold. Throughout the video students experience all the basic and necessary components needed to compute volume and surface area. I appreciate how he mentions the distinction between the units used in each, because I have personally seen several students miss this aspect. I think this resource would be very useful as a introductory video when students are beginning to explore surface area and volume. Students that watch this video should already know the needed area content knowledge. Even though it would be helpful for students to be exposed to volume of a cube before this, I do not think it is necessary (given they learn it after or at the same time). This would also be a good tool for review before an exam/quiz. Since it's on YouTube, students will be able to access it easily.
“Cylinder volume and surface area | Perimeter, area, and volume | Geometry | Khan Academy." YouTube. YouTube, 12 Apr. 2011. Web. 27 July 2017. <https://www.youtube.com/watch?v=gL3HxBQyeg0>.
 Abstract: Compared to the MashUp Math video (above), this clip uses a different approach that focuses more on academic vocabulary. This is recognizable from the start when she uses the words "curved surface", "right circular cylinder", and "central axis". It discusses the properties and characteristics of a cylinder, modeling the central axis point, uniform cross section, and radii. I believe that students will be able to test their knowledge on the vocabulary in this video, and i could see myself using it in my future classroom. I would most likely ask the students to define using their own reasoning a list of the vocabulary terms discussed throughout the video. Then, I would play the video in sections and have a brief discussion about how their definitions compared. A specific aspect of this video that caught my attention was how she compared the volume and surface area. This is something to highlight because many students go right for the formula/s and disregard the actual process it represents (In my opinion such students are often the ones that complain about no formula's given on a test/quiz). Since the vocabulary can be difficult for students who aren't familiar with 3-dimensional shapes, I would recommend not starting out with this video. I think it would be a good guide to build up to.
Print Texts:
Bibliographic Information:
Smith, Mary. (25 Sep. 2016). How to Calculate the Volume of a Cube - Formula and Examples. One How To. 27 July, 2017. <https://education.onehowto.com/article/how-to-calculate-the-volume-of-a-cube-formula-and-examples-6168.html>
Summary:
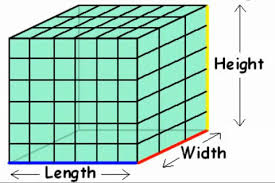
Mary Smith’s OneHowTo article gives students a quick lesson
on how to calculate the volume of a cube using its formula. With 5 easy steps, students
can begin to build a routine when faced with situations where volume is
calculated. Included in the article are large and clearly labeled cubes that
guide students to recognize the 6 individual sides. The use of similar objects
used in this article is helpful for students to recognize the 3 dimensional
shapes they are surrounded with daily. One example given was how a cube is like
a 6-sided dice that you play board games with. I think these steps could be
used to generalize an approach students can refer to when learning more about
volume. It would be beneficial for students to create their own steps as more
figures are explored.
Text Complexity:
After plugging in the text in StoryTools, the quantitative results suggested the text is for 8.0, 8.9, and 9.5 grade levels. I am going to slightly disagree with these findings and say this is a grade 7 text, because of how short the sentences are, and how simple the word context is. For the qualitative measurement I would say this is a slightly complex text. The text structure is clear and ordered from 1-5 which falls under slightly complex. Under language features I would consider this to be moderately complex because there were a couple content specific terms that students most likely would need clarification on. Since there was only one single topic and it portrayed a single theme, this text would fall under slightly complex for meaning and knowledge demands.
Task Complexity:

Since this is a fairly easy reading, I have paired it with a exceedingly complex task. The purpose of this text is to get students thinking about volume and the formula. It gets them prepped for the fulfilling task that follows. This article (cited below) is from the NCTM’s website and talks about a research study conducted by teachers on students. In the study, students are challenged to communicate their reasoning while they peruse an activity that requires them to design and build nesting boxes. (A.K.A a bird house- task is detailed in the article). First, students are asked to reveal their drawings of the bird house, they will be evaluated by their drawing and put in one of three categories; pictorial, schematic, and isometric. The bird houses represent rectangular prisms, which are closely related to the cube discussed in the article. Then, students are asked to scale their dimensions and create a three-dimensional view. After, they create a net and write a step-by-step procedure that they will take when constructing their house. Finally, they use their calculations and measurements to build their own personal bird house.
I choose this activity because of the way it highlights geometry through its use of real-word situations. I also liked the community connectivity it gives students as they work together and eventually display their work at home. It also supports differentiated instruction through the freedom and creativity supported with the procedure-several representations. The high cognitive demand of this task supports several of the Content Standards including: modeling mathematics, critiquing the arguments and reasoning of others, use of abstract reasoning through different perspectives, and constructing viable arguments. The CCSSM teachers in the study observed are said to be from 4th, 6th, 7th, and 8th grade (the most frequently used standards were from 7th grade). Despite this, the task can be used in other grades as well so i think that 7th grade is an appropriate placement/rating.
Cianca, S. A. (2013). Bird Boxes Build Content Area Knowledge. Mathematics
Teaching in the Middle School, 19(1), 22-29.
Additional Text:
Tong, J. (1997). Area and Perimeter, Volume and Surface Area. The College Mathematics Journal, 28(1), 57. doi:10.2307/2687189

Abstract:
Culturally Relevant Texts:
Bibliographic Information:
Meban, C. (1983). The surface area and volume of the human fetus. Journal of Anatomy, 137(Pt 2), 271-278.<https://www.ncbi.nlm.nih.gov/pmc/articles/PMC1171820/>.
 Summary:

Many are familiar with the debate of human fetal growth as it is a
common topic in politics. This lab report shows a mathematical exploration into
the topic and develops formulas for the surface area and volume of the human
fetus. These formulas are an estimation based off 79 human fetuses. There are
several different representations of the data which students can evaluate and
draw data from to create examples that support the formulas presented. Scatter
plots, tables, and a nomogram are displayed. There are many topics of error
discussed that students can test, such as the factor that a fetus is an
irregular shape. Students might have trouble comprehending the detailed mathematical
description of how the 3-dimensional fetus is measured. Fortunately, the method
of displacement is introduced which will give students a new perspective on how
volume is measured. It also provides them with an activity they can refer to
when testing volumes of irregular figures. There are many activities that could
be conducted in class to simulate this procedure. Since each fetus was at a
different place developmentally, they varied in size and shape which also
disrupted the accuracy of the calculations. Overall, they estimated as well as
they could and the mathematics behind it is reasonable.
Text Complexity:
The quantitative reading levels by StoryTools recommends that this text should be used for grades 10.1, 12, 12.1. Specifically it ranked the Gunning fog index at grade 13. I believe this is a difficult text, but I would accommodate for this by taking pieces of the article and reorganizing it so that it was inviting and not dreadful like the format is currently. By doing changes like this I think that students in 8th or 9th grade will manage just fine. Using the qualitative rubric i would rate the text structure as exceedingly difficult, and the language features very complex. The reasoning being that the graphs and tables really help your understanding, while the concept itself is very abstract. There are several unfamiliar terms and complex language is throughout the text. It might take students more than one read with this text. The flow of the article is difficult, but that might be because of the format. Besides that, it is still a difficult topic to interpret because of its complex and abstract theme.
Task Complexity:
The purpose of this is to spark students' curiosity about how mathematics plays roles in the world they live in. It also challenges them to think about mathematics critically, rather than just plugging in numbers and memorizing formulas. This example gives students an opportunity to challenge themselves and their ability to reason with mathematical vocabulary. To combat the exceedingly complex text I would choose a task that is slightly complex to achieve balance in the lesson. One strategy that I think would be beneficial and not overwhelming is R.A.P. First students Read the text without writing without stopping just trying to get a broad idea about what it is talking about. Then, students re-read the text and Annotate the text using symbols to mark question areas, important facts, main ideas, agree/disagree, etc. Finally, students Process the text by writing a summary of 3-5 sentences. As mentioned above, short activities can be implemented as students read like discussions about what annotations others produced or opinions.
Additional Text:
Maida, Paula, and Michael Maida. "How Does Your Doughnut Measure Up?" The National Council of Teachers of Mathematics 5th ser. 11 (2006): 212-19. Nctm.org. Web. 27 July 2017. <http://www.nctm.org/Publications/mathematics-teaching-in-middle-school/2006/Vol11/Issue5/How-Does-Your-Doughnut-Measure-Up_/>.